Industry-Focused Curriculum
Learn the technical foundations, tools and workflows analysts use, through a path that builds in order.
You do not need a technical background to start. Learn the fundamentals, work with real data and build projects that show what you can actually do.
Businesses collect data every day. The people who can clean it, understand it and turn it into useful insight help teams make better decisions. This program is designed to help you build those practical foundations—and create projects that show how you think.

Students, graduates, working professionals and career-switchers who want a structured way to enter data and analytics.
Data skills are becoming valuable across industries. Learn to ask better questions, analyse evidence and share insights.
Fintech, e-commerce and SaaS companies, healthcare, consulting firms, product companies and in-house analytics teams.
Data Analyst, Business Analyst, BI Analyst, Product Analyst, Data Scientist and related roles, depending on your skills.
 95+ Hours
 Online Mode
 Beginner Friendly
 Certificate
Watching tutorials can teach you concepts, but confidence comes from applying them. This program is designed to help you learn, practise, receive guidance and build work you can discuss when you apply for opportunities.
Learn the technical foundations, tools and workflows analysts use, through a path that builds in order.
Live sessions with recorded support, so you can keep learning alongside college or work without falling behind.
Build projects that demonstrate analysis, dashboards, models and the problem-solving behind each of them.
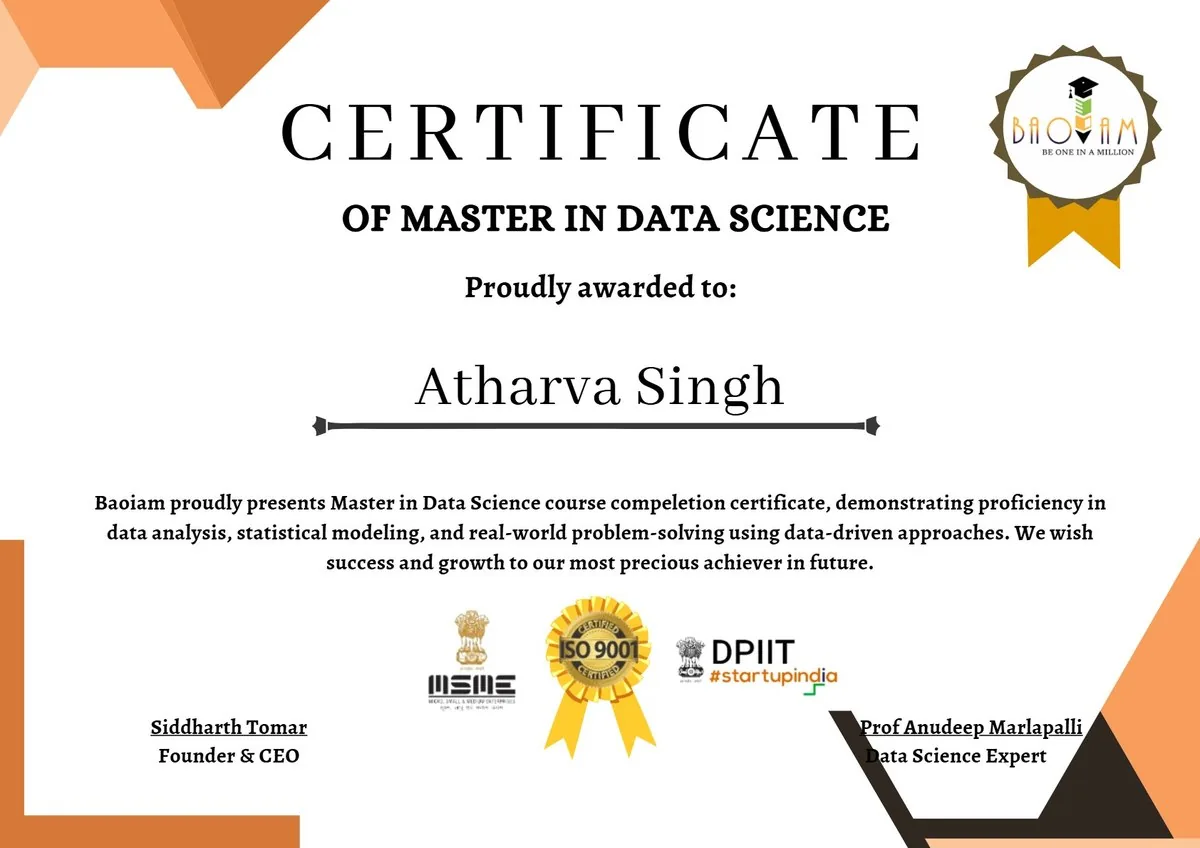
Receive a verifiable record of the program you completed and the work you produced, ready to show an employer.
Get feedback and guidance from qualified mentors as you build, so you learn what to fix while it still matters.
Career preparation, mock interviews and support in pursuing the analyst roles you are actually aiming for.



Every module ends with a graded project. Every project makes your portfolio stronger.
6 modules32 hours10 Projects
Start with the language that helps you work with data. Build the fundamentals slowly enough to understand them and practically enough to use them.
Deliverable: A documented Python data-analysis toolkit that shows how you write, organise and work with data.
Learn how to look beyond numbers and ask what they actually mean. Build the statistical thinking needed to make more informed conclusions.
Deliverable: An exploratory analysis with the findings communicated through a clear professional report.
Real-world data is rarely clean. Learn how to identify problems, handle missing information and prepare data before analysis begins.
Deliverable: A reproducible data-cleaning workflow with documented decisions.
A chart is easy to create. A useful story is harder. Learn how to choose visuals that help people understand what the data is actually saying.
Deliverable: An interactive dashboard, presented with the business insights behind it.
Move from understanding what happened to exploring how models identify patterns and make predictions—while learning to evaluate whether a model is actually useful.
Deliverable: Trained and compared models, with the results explained in a performance report.
Explore how modern AI works with images and language, while building a practical understanding of neural networks, NLP and large language models.
Deliverable: An AI-powered sentiment analysis project with a clear demonstration of how it works.
 Python
 Power BI
 Tableau
 MYSQL
MYSQL
 Tensor flow
 VS Code
 GitHub
 Jupyter
 AWS
AWS
 Pandas
General industry estimates for these roles — not a guaranteed outcome.
Top hiring industriesTurn raw data into the insight a business can actually act on.
Connect business problems, the people involved and the data behind them.
Create the reporting and dashboards that decisions get made on.
Requires deeper technical foundations and further specialisation.
An ML-focused path that builds on additional specialisation.
Use metrics and experiments to understand product behaviour.
 Google
 Amazon
 Microsoft
 Infosys
 TCS
TCS
 Accenture
 Wipro
Wipro
 Cognizant
 Deloitte
 EY
EY
 Flipkart
 Swiggy
Same live classes and the same 1:1 mentoring, pointed at a different skill. Pick the one that fits where you want to go next.
A certificate should represent more than attendance. Finish the programme and get a verifiable certificate for your professional profile — with a unique ID and QR, tied to your final project.
Get Your CertificateYou only need a place to begin. Start with one concept, solve one problem, build one project. Then another, until it is work you know how to do.